Collecting soil samples to a depth of 6 to 8 inches is standard protocol for western Oregon. When the sampling protocol was developed, this depth was typical of tillage for seedbed preparation. As well as preparing the seedbed, tillage controlled weeds and mixed nutrients and lime into the soil. Presently, tillage is not always used, so a single standard sampling depth may no longer apply (figure 1).
Phosphorus (P), potassium (K), calcium (Ca), magnesium (Mg), zinc (Zn), and lime have limited mobility in the soil. When applied to the soil surface, these materials remain in the top 1 to 2 inches unless incorporated by tillage. Nutrient accumulation at the surface occurs frequently in no-till or direct-seed cropping systems, pastures, and fields in which perennial crops have been grown for 3 or more years. When soil is sampled to a depth of 6 to 8 inches, the top 1 to 2 inches, which have higher nutrient concentrations, are mixed with the lower 6 to 7 inches, which have lower nutrient concentrations. This situation results in uneven distribution of the surface-applied nutrients in the soil sample. In addition, continued application of ammonium-based nitrogen (N) fertilizers acidifies the soil surface.
To evaluate surface and below-surface conditions, collect soil samples from multiple depths. This sampling method helps identify areas where nutrient applications are warranted and reveals areas of low pH at the soil surface.
Information in this publication will help producers and agronomists minimize crop losses and maximize economic returns.
The following section describes scenarios in which collecting soil samples from multiple depths would be beneficial. The examples include situations in which pH or nutrient stratification has occurred in western Oregon crops.
Soil pH Stratification
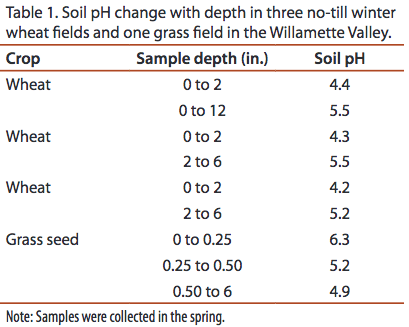
Applying N fertilizer acidifies soil at the approximate rate of 0.1 pH unit per year for every 100 lb/a of ammonium-N applied. Without tillage, the top 1 to 2 inches of soil will acidify much faster than soil below. Table 1 shows soil pH stratification in four Willamette Valley fields.
Example 1: No-Till Wheat
Winter wheat tolerates moderately acidic soil (pH 5.4). However, wheat yield and growth are markedly reduced if the soil pH is 5.0 or lower (figures 2 and 3). During germination and early growth, winter wheat can be susceptible to low pH at the soil surface, a condition that results from applying topdressed N fertilizer to perennial crop fields, such as grass grown for seed, that are direct seeded to wheat.
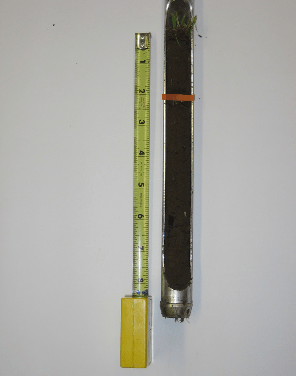
In a no-till winter wheat system, monitor soil pH by collecting an incremental, or stratified, soil sample. To do this, insert a soil probe 6 to 8 inches, and then separate the top 2 inches of soil from the remaining depth (figure 4).
When soil pH in the top 2 inches is below 5.0, apply lime and mix with tillage to make a seedbed suitable for germination and early growth. In this situation, top-dressed lime without tillage immediately before planting will not adequately change the pH in the surface soil. Lime is immobile; thus, it does not have the ability to move into the soil before seed germination. When soil pH is below 5.5 in the top 6 or 8 inches, apply and incorporate lime (figure 5).
Example 2: Peppermint
Top-dressed lime creates pH stratification because it changes soil pH only in the top 0.5 to 2 inches (figure 6). Below this depth, soil pH changes due to top-dressed lime are uncommon even a year after application. This situation is challenging; topdressed lime creates a higher soil pH at the surface, but pH in the soil below can be too low to maintain adequate crop growth. Raising pH below 2 inches requires mixing lime into the surface with tillage.
Example 3: Orchards
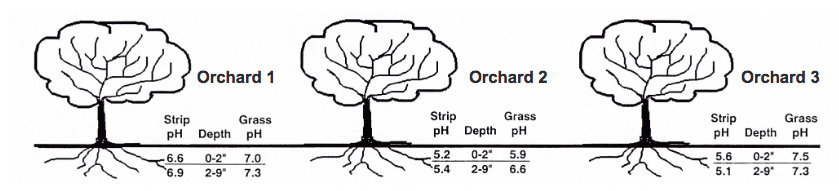
Similar to perennial grass seed fields, fruit and nut orchards are managed in the absence of tillage and receive top-dressed nutrients and lime. Soil collected from several apple and cherry orchards in the Hood River Valley revealed pH stratification (figure 7). In these orchards, soil pH was measured under the tree drip line (strip pH) and under the grass between tree rows.
In orchards 1 and 2, soil pH under the drip line differed little with depth. In all orchards, soil pH was lower under the drip line than under the grass. The lower soil pH under the drip line was a result of repeated surface N applications. In orchard 3, which received a surface lime application, pH in the top 2 inches of soil under the drip line was higher than that in the soil below.
These three examples are from common production systems in western Oregon. However, pH stratification can occur in many other cropping systems in which crops are perennial or grown with limited tillage (e.g., caneberries, blueberries, nurseries, Christmas trees, and pastures). Information from a stratified soil sample can help you implement management changes before conditions occur that create serious crop growth limitations.
Nutrients in Surface Soil
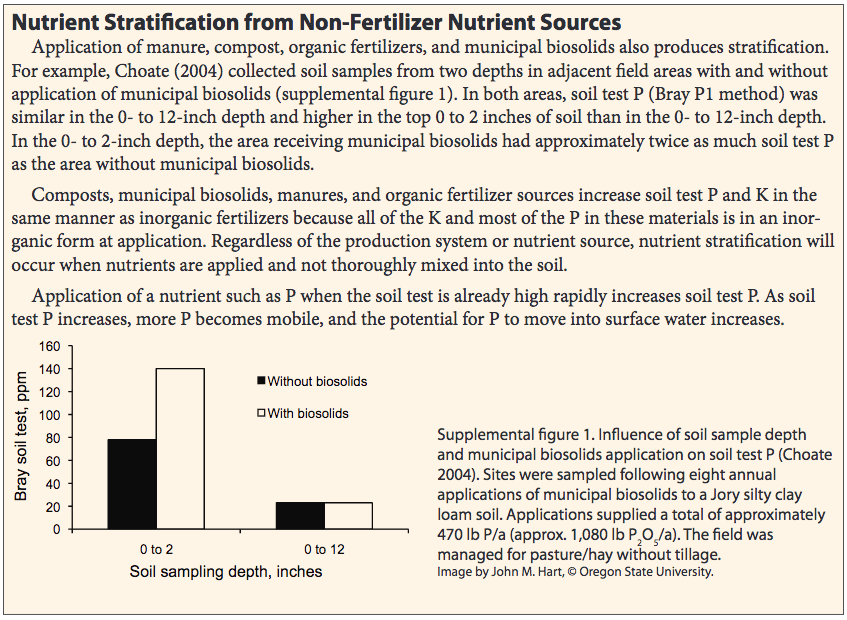
The previous examples show that top-dressed lime or N changes pH in the soil surface when tillage is absent. In a similar manner, surface application of other nutrients, such as P and K, without tillage increases the concentration of these nutrients at the soil surface. If these nutrients are applied to the soil surface without tillage, they will remain in the top 1 to 2 inches.
For example, soil test P in a Willamette Valley clover–grass pasture was 4 ppm. After 6 years of P application and adequate crop growth, soil test P was still 4 ppm. Both soil samples were collected to a depth of 8 inches, the historical norm. In contrast, the soil test P of a sample collected from the top 3 inches after 6 years of P application was 19 ppm. This example shows that fertilizer P stayed at the soil surface and was available for plant use. The soil samples collected to a depth of 8 inches mixed subsurface soil having a low P soil test with surface soil having a higher P soil test. Taking soil samples from multiple depths showed that fertilizer P applications did not change soil test P uniformly in the soil.
Nutrient accumulation at the surface can occur in a short time with relatively low nutrient application and removal rates. Surface application of 30 to 40 lb/a P2 O5 will result in stratification within 2 to 3 years.
Potassium is similar to P. It remains where it is placed when applied at agronomic rates. Figure 8 illustrates two important concepts. First, soil test K in the surface inch of soil can increase rapidly. After only 3 years of surface K fertilizer applications of 80 lb/a and straw residue burning in a perennial ryegrass field, soil test K in the top 1 inch and top 6 inches was 180 and 78 ppm, respectively. Second, soil test K stratification can affect fertilizer recommendations. The Oregon State University Extension fertilizer guide for perennial ryegrass (Perennial Ryegrass Grown for Seed (Western Oregon), FG 46-E; Hart et al. 2005) recommends applying K fertilizer when soil test K is below 150 ppm. On the basis of the 6-inch sample, K fertilizer application is recommended. However, the K value from the top inch of soil indicates that no fertilizer is needed. This example illustrates the importance of stratified sampling.
Plants obtain nutrients from much of the root zone, including the soil surface. Nutrients in the top 2 inches of soil supplement plant nutrient needs from the entire rooting zone. Low soil test values from a sample collected from a 6- to 8-inch depth will result in a recommendation for fertilizer application even when sufficient nutrients such as P and K are available in the surface soil. On established fields, collect soil samples from (1) the top 2 inches of soil and (2) the 2- to 8-inch layer of soil. Compare soil test values from each depth to evaluate changes in nutrient concentration over time.
Tillage and Nutrient Stratification
Nutrients accumulate rapidly in the soil surface as a result of repeated fertilizer applications without tillage. Surface nutrient accumulations can be measured after a short time and from continual low application rates.
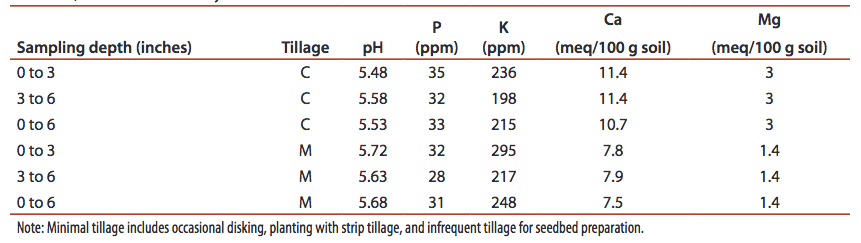
Conversely, tillage mixes P, K, Ca, Mg, and lime, which have limited mobility in soil. Table 2 shows that conventionally tilled fields did not exhibit much nutrient or pH stratification and that nutrient stratification did not occur in fields with intermittent tillage. Minimal or infrequent tillage eliminates differences in soil test values between the top 2 inches and the 0- to 6-inch depth. Therefore, when a field is tilled at least once during a 3-year period, take soil samples at the conventional depth of 6 to 8 inches.
Stratified Soil Sampling: Putting the Idea into Practice
Do not sample soil only from the surface; you need to know the nutrient and pH status of more than the surface 2 inches. To take a stratified soil sample, insert a soil probe 6 to 8 inches, and then separate the top 2 inches of soil from the remaining depth.
For no-till or direct-seed cropping systems, pastures, and fields where perennial crops have been grown for 3 or more years and have received annual surface fertilizer, wait 2 to 3 years after establishment to begin stratified sampling. Use the following key to determine if collecting a stratified soil sample would be useful.
1. What is the purpose of sampling?
• Agronomic or to determine nutrient or fertilizer application rate
→ Go to Question 2.
• Monitoring or regulatory to follow nutrient movement or accumulation
→ Refer to Pacific Northwest Extension publication PNW 570-E, Monitoring Soil Nutrients Using a Management Unit Approach (Staben et al. 2003).
2. Is the field tilled at least once every 3 years?
• Yes → use a conventional (6 to 8 inches) sampling depth.
• No → Go to Question 3.
Has fertilizer been top-dressed for more than 2 or 3 years?
•No → Use a conventional sampling depth. The crop will not respond to nutrient application even if the nutrient concentration differs between the surface (0 to 2 inches) and subsurface (4 to 6 inches) samples.
• Yes → Stratified sampling may provide a benefit because
- the field has not been tilled for 3 or more years, which is sufficient time for stratification to develop;
- when the crop grows rapidly and needs nutrients, roots are present in moist soil near the soil surface; and
- the higher nutrient content in surface soil compared with subsurface soil means that a conventional sample will underestimate nutrient availability.
Conclusions
The idea of collecting shallow soil samples is not new. Comparison of soil tests results from before establishment with results from various depths continues to be important in western Oregon cropping systems. Measuring the surface soil pH can help you reduce potential stand losses, and obtaining similar information for soil surface nutrients such as P, K, Ca, Mg, and Zn will help you make informed nutrient management decisions and maximize economic returns.
References
Choate, J.B. 2004. “Phosphorus Availability in BiosolidsAmended Soils.” Master’s thesis, Oregon State University, Corvallis.
Hart, J.M., M.E. Mellbye, D.A. Horneck, G.A. Gingrich, W.C. Young III, and T. Silberstein. 2005. Perennial Ryegrass Grown for Seed (Western Oregon). FG 46-E. Corvallis, OR: Oregon State University Extension Service.
Horneck, D.A. 1995. “Nutrient Management and Cycling in Grass Seed Crops.” PhD diss., Oregon State University, Corvallis.
Staben, M.L., J.W. Ellsworth, D.M. Sullivan, D. Horneck, B.D. Brown, and R.G. Stevens. 2003. Monitoring Soil Nutrients Using a Management Unit Approach. PNW 570-E. Corvallis, OR: Pacific Northwest Extension Publications.
For More Information
Hart, J., G. Pirelli, L. Cannon, and S. Fransen. 1996. Pastures (Western Oregon and Western Washington). FG 63. Corvallis, OR: Oregon State University Extension Service.
Jackson, T.L., E.H. Gardner, and T.A. Doerge. 1983. Peppermint (Western Oregon—West of Cascades). FG 15. Corvallis, OR: Oregon State University Extension Service.
This information is provided for educational purposes only. If you need legal [or tax] advice, please consult a qualified legal [or tax] adviser.
Trade-name products and services are mentioned as illustrations only. This does not mean that the Oregon State University Extension Service either endorses these products and services or intends to discriminate against products and services not mentioned.
Use pesticides safely!
- Wear protective clothing and safety devices as recommended on the label. Bathe or shower after each use.
- Read the pesticide label—even if you’ve used the pesticide before. Follow closely the instructions on the label (and any other directions you have).
- Be cautious when you apply pesticides. Know your legal responsibility as a pesticide applicator. You may be liable for injury or damage resulting from pesticide use.
© 2018 Oregon State University.
Extension work is a cooperative program of Oregon State University, the U.S. Department of Agriculture, and Oregon counties. Oregon State University Extension Service offers educational programs, activities, and materials without discrimination on the basis of race, color, national origin, religion, sex, gender identity (including gender expression), sexual orientation, disability, age, marital status, familial/parental status, income derived from a public assistance program, political beliefs, genetic information, veteran’s status, reprisal or retaliation for prior civil rights activity. (Not all prohibited bases apply to all programs.) Oregon State University Extension Service is an AA/EOE/Veterans/Disabled.
About the authors